
Variance in statistics measures how much a set of numbers is spread out from their mean. It quantifies the average squared difference between each value and the mean, which helps us understand the variability or dispersion in data.
When analyzing data, one term that frequently appears in textbooks, research papers, and reports is variance. Therefore, if you are new to statistics, you might wonder, “What does variance mean, and why is it important?” Understanding variance is essential because it allows you to interpret data accurately, compare datasets, and make informed decisions.
In this guide, you will learn precisely what variance means in statistics, how it is calculated, why it matters, and how it differs from related concepts like standard deviation. Additionally, you will see practical examples and tips for interpreting variance in real-world data.
What Does Variance Mean in Statistics?
Variance is a measure of how spread out a set of numbers is around the mean.
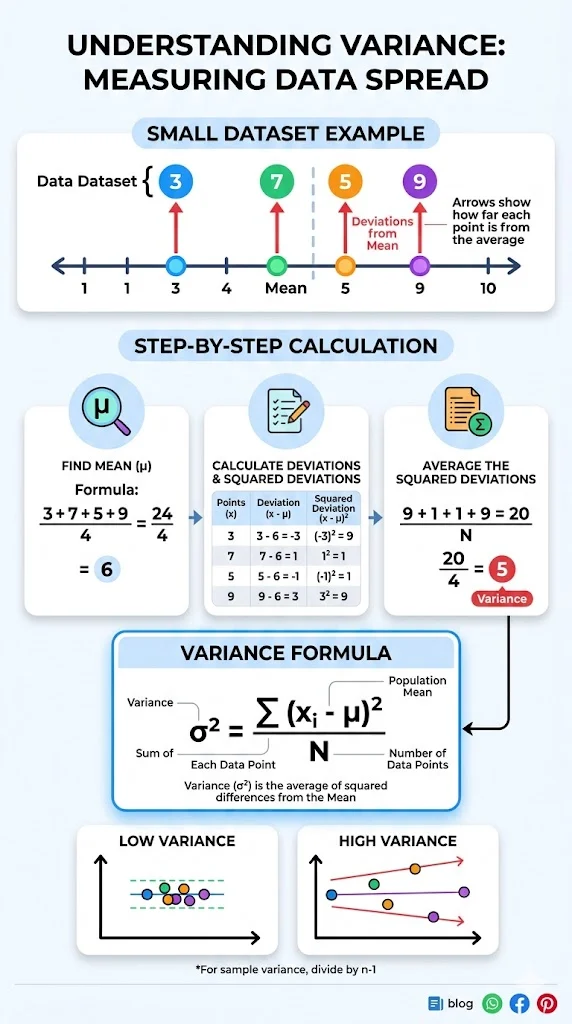
In simple terms, variance shows how far the data points deviate from the average value. Consequently, a small variance indicates that the data points are close to the mean, while a large variance shows that the values are more spread out.
Mathematically, variance is the average of the squared differences between each data point and the mean. It is often denoted by σ² for a population and s² for a sample.
Why Variance Is Important
Variance plays a crucial role in statistics for several reasons.
First, it provides insight into consistency, reliability, and risk within a dataset. For example, in finance, high variance in stock prices indicates higher risk. Moreover, in manufacturing, high variance in product measurements may signal quality issues. Additionally, in research, variance helps determine the spread and reliability of experimental results.
Therefore, variance is foundational for many other statistical measures, including standard deviation, confidence intervals, and hypothesis testing. Without understanding variance, analyzing data effectively becomes much more difficult.
How to Calculate Variance
Variance can be calculated for both populations and samples, and the formulas are slightly different.
Population Variance Formula
For a population with N data points:σ2=N∑i=1N(xi−μ)2
Where:
- σ² = population variance
- xᵢ = each data point
- μ = population mean
- N = number of data points in the population
Sample Variance Formula
For a sample with n data points:s2=n−1∑i=1n(xi−xˉ)2
Where:
- s² = sample variance
- xᵢ = each sample point
- x̄ = sample mean
- n = number of sample points
Notice that for a sample, we divide by n-1 instead of n. This is called Bessel’s correction, which helps produce an unbiased estimate of the population variance.
Step-by-Step Example
Suppose we have the following data set of exam scores: 80, 85, 90, 95, 100
Step 1: Calculate the mean
Mean=580+85+90+95+100=90
Step 2: Subtract the mean and square the differences
| Score | Difference from Mean | Squared Difference |
|---|---|---|
| 80 | -10 | 100 |
| 85 | -5 | 25 |
| 90 | 0 | 0 |
| 95 | 5 | 25 |
| 100 | 10 | 100 |
Step 3: Calculate the variance
σ2=5100+25+0+25+100=50
Thus, the variance is 50, which indicates the average squared deviation from the mean.
Interpreting Variance
Although variance provides valuable information, it is measured in squared units, which can sometimes make interpretation less intuitive. Therefore, we often use standard deviation, which is the square root of variance, to describe the spread in the original units.
- If variance is high, the data points are widely spread.
- If variance is low, the data points are closely clustered.
- If variance is zero, all data points are identical.
By understanding these interpretations, you can better evaluate datasets in various contexts.
Variance vs Standard Deviation
Variance and standard deviation are related but distinct concepts.
| Measure | Formula | Units | Interpretation |
|---|---|---|---|
| Variance | Average squared deviation from the mean | Squared units | Quantifies spread numerically |
| Standard Deviation | Square root of variance | Same as original data | Measures spread in the same units as data |
In practice, standard deviation is easier to interpret, while variance serves as the foundation for many statistical analyses. Furthermore, both measures are essential when analyzing datasets comprehensively.
Real-World Applications of Variance
Variance is used in numerous fields. For example:
- Finance: It helps assess investment risk by calculating variance of returns.
- Quality Control: It monitors consistency in manufacturing processes.
- Education: It evaluates variability in test scores or student performance.
- Research: It analyzes experimental data to determine reliability and consistency.
Consequently, understanding variance allows professionals to make better, data-driven decisions.
Common Mistakes in Using Variance
Despite its importance, variance is often misunderstood.
- Confusing population variance with sample variance – remember to use n-1 for samples.
- Interpreting variance in squared units directly without considering standard deviation.
- Ignoring outliers, which can significantly inflate variance.
- Using variance alone to make decisions; sometimes standard deviation or other metrics are more interpretable.
By avoiding these mistakes, you can leverage variance effectively in real-world scenarios.
Related Terms
- Mean: The average value of a dataset, which is central to variance calculation.
- Deviation: The difference between a data point and the mean.
- Standard Deviation: The square root of variance, easier to interpret.
- Covariance: Measures how two variables vary together and is closely related to variance.
Frequently Asked Questions
1. What does variance measure in statistics?
Variance measures how spread out a set of numbers is from the mean.
2. How is variance different from standard deviation?
Variance is the average squared deviation, while standard deviation is its square root, in the same units as the data.
3. Why do we square the differences when calculating variance?
Squaring ensures all deviations are positive and emphasizes larger differences.
4. What is the difference between population variance and sample variance?
Population variance divides by N, the total population size, whereas sample variance divides by n-1 to correct for bias.
5. Can variance be negative?
No, variance is always zero or positive because squared differences cannot be negative.
6. How do outliers affect variance?
Outliers increase variance significantly because differences from the mean are squared.
7. Why is variance important in statistics?
Variance helps measure data spread, assess risk, and inform decisions in research, finance, and quality control.
8. How is variance used in real life?
It is used in finance to analyze stock volatility, in education to study test score differences, and in research to assess data reliability.
Conclusion
Variance is a fundamental statistical concept that measures the spread of data points around the mean. It is essential for understanding variability, comparing datasets, and interpreting results accurately.
Key takeaways:
- Variance quantifies spread using squared differences from the mean
- Population variance and sample variance formulas differ slightly
- High variance indicates widely spread data, low variance indicates data is clustered
- Variance is foundational for standard deviation, covariance, and many statistical analyses
Mastering variance helps you analyze and interpret data more confidently across finance, research, education, and everyday decision-making.
Discover More Post
What Does Excluded Mean in PowerSchool – DefineHubs.com –
What Does TS Mean in Snapchat? Full … – DefineHubs.com –
What Does Volume Mean in Science? Definition, Formula …